

The beginner’s guide to understanding Agile performance metrics without the jargon, headaches, or boring charts

Ever felt like your Agile team is sprinting on a treadmill — moving fast but not actually going anywhere? Yeah, it happens. Many teams hustle through sprints without knowing if they’re truly getting better or just getting busier. That’s where Agile metrics swoop in to save the day.
Think of Agile metrics as the fitness tracker for your project. They tell you how fast you’re moving, how far you’ve come, and if you need to maybe… take a breath.
Tracking Agile performance metrics isn’t about making boring reports for your boss. It’s about helping your team deliver better, faster, and happier.
Let’s break down 10 beginner-friendly Agile metrics you can actually use — without needing a PhD in Project Management.
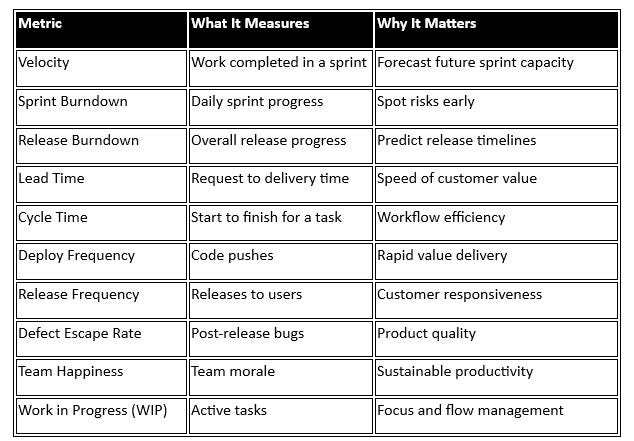
Quick Cheat Sheet: 10 Agile Metrics at a Glance
(Visual learners, this one’s for you!)

Track a few metrics well. Build agility for the long haul.
Now, let’s break these down one by one…
1. Velocity
What It Is:
Velocity measures how much work a team completes during a sprint, usually in “story points”.
Why It Matters:
It’s like checking how many pizzas you can bake in a day — good to know if you’re planning a party (or a product release).
Example:
Complete 40 story points in a sprint? Your velocity is 40. Boom.
Tips:
- Track over 3–5 sprints for a reliable average.
- Use it to plan — not to start weird velocity competitions.
2. Sprint Burndown
What It Is:
Sprint burndown charts show how much work is left each day during a sprint.
Why It Matters:
Imagine a progress bar on your favorite app. Now imagine it’s stuck. Not fun, right? Sprint burndowns keep work flowing.
Example:
Start with 100 hours of work. Mid-sprint, you’re down to 40? High five!
Tips:
- Update daily.
- If it flatlines, it’s time for a team huddle.
3. Release Burndown
What It Is:
Release burndown tracks work across multiple sprints leading up to a big release.
Why It Matters:
Big deadlines sneak up like birthdays. A release burndown means no last-minute scrambles.
Example:
500 story points to release. Watch that number drop each sprint like a countdown to launch.
Tips:
- Review after each sprint.
- Adjust scope if you’re falling behind (and be kind to yourselves).
4. Lead Time
What It Is:
Lead time is how long it takes from an idea popping up to it reaching customers.
Why It Matters:
Shorter lead time = quicker “Yesss!” from customers.
Example:
Request on March 1st, live on March 15th? That’s a 14-day lead time.
Tips:
- Track outliers — they tell juicy stories.
- Find and fix bottlenecks.
5. Cycle Time
What It Is:
Cycle time is how long a task takes once the team starts working on it.
Why It Matters:
Ever ordered coffee and waited an hour? Yeah, nobody likes that.
Example:
Start task on Monday, done by Thursday = 4 days cycle time.
Tips:
- Keep tasks small.
- Celebrate smooth workflows.
6. Deploy Frequency
What It Is:
Deploy frequency tracks how often code hits production.
Why It Matters:
Frequent deployments = tiny, manageable changes. Less drama, more “ship it”.
Example:
Three deployments a week? You’re basically Agile rockstars.
Tips:
- Automate, automate, automate.
- Even once a week is a win to start.
7. Release Frequency
What It Is:
Release frequency is how often users see new features or fixes.
Why It Matters:
Users love small, regular treats — like surprise cupcakes, but for software.
Example:
Biweekly app updates? Nice. Quarterly? Time to step it up.
Tips:
- Separate deployments and releases with feature flags.
- Start simple, iterate fast.
8. Defect Escape Rate
What It Is:
Defect escape rate measures bugs that sneak past your team and land with users.
Why It Matters:
Escaped defects = sad users (and late-night bug fixes).
Example:
10 bugs found after release from 100 features? That’s a 10% defect escape rate.
Tips:
- Catch bugs early with better testing.
- “Shift left” and test sooner.
9. Work in Progress (WIP)
What It Is:
Work in Progress (WIP) is how many tasks your team’s juggling at once.
Why It Matters:
Juggling one ball = fun. Juggling 10 balls = disaster.
Example:
10 tasks in progress but 4 team members? Warning bells.
Tips:
- Limit WIP per person or stage.
- Finish stuff before grabbing more.
10. Team Happiness
What It Is:
Team happiness measures if your team is loving life — or quietly plotting an escape.
Why It Matters:
Happy teams = productive teams. Unhappy teams = high turnover and sad sprints.
Example:
Anonymous survey: “How happy are you on a scale from 1 to 10?” Track the trend.
Tips:
- Survey regularly.
- Listen. Seriously listen.
Conclusion: Start Small, Dream Big
You don’t have to become a metric wizard overnight. Pick a few like velocity and sprint burndown. Nail those. Then add more as you grow.
Remember: these Agile metrics aren’t about blame — they’re about better teamwork, faster delivery, and maybe even fewer “Can you stay late tonight?” conversations.
Master your metrics, and you’ll master your delivery!
Quick Metrics Recap: Your Agile Cheat Sheet
🔥If you liked this article, check out the next one where we go over Scrum events with real-life examples, humor, and no buzzwords.
Written by

Simina F.
| howtobecomeapm.com – Author
|